
Whose time can you see?
Admins see everyone’s time. Team Leads see their team’s time, and Project Managers see everyone’s time on the projects they manage, including sub-projects. Everyone else sees only their own time. Team Leads and Project Managers can also filter and group by Member.
Filters
Start by narrowing down what you want to see. You can filter by:
- Time period — choose any date range
- Member, client, project, task, status, and priority — combine multiple filters to get to exactly the data you need
Overview metrics
At the top of the report, you'll see a summary for the selected filters:
- Total logged hours
- Billable time and amount
- Non-billable time
- Average daily hours
Chart options
The chart starts as stacked bars, split the same way as the breakdown table. If the table has no grouping, the bars split by billable status. To change the chart, open Chart options above it:
- Chart type — Stacked bar shows one bar per period, split into colors. Pie chart shows each value’s share of the whole report period.
- Stacked by or Slice by — choose what the chart is split by, such as project, client, member, task, tag or billable status. This does not change the table. Same as table puts the chart back in step with the table’s first grouping. Splitting by member follows the same permissions as grouping the table by member.
- Show by — for stacked bars, choose day, week, month, quarter or year. You see the sizes that give 2 to 62 bars for your date range, so a one-year report does not offer Day.
- Measure — for a pie chart, choose Logged time or Billable time. This option is hidden when the chart is sliced by billable status.
Once you change something, Reset to default appears in Chart options and returns the chart to its starting setup.
Reading and using the chart
- Open the time behind a slice: click a slice of the pie chart to open Time logs filtered to that value, for groupings that support it.
- Other: when there are more than 8 values, the smaller ones fold into Other. On a pie chart, select Other in the legend to see what it holds. The Other slice does not open Time logs.
- Totals that add up to more: when the chart is split by something an entry can have several of, such as tags, the entry counts toward each value. The parts can add up to more than the total, and the chart notes this.
- Saved and shared reports: chart options are saved with the view, so saved views, shared reports and public links open with the same chart. See Sharing Reports.
- PDF export: the Summary PDF still shows billable and non-billable bars, whichever chart is on screen. See Exporting reports from Toggl.
Breakdown table
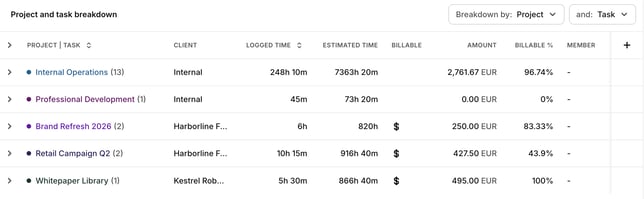
Scroll down to see a detailed breakdown table. You can sort by two dimensions at once for an in-depth view.
Breaking down by role: choose Role to see hours by role (for example Designer or Developer), on its own or together with project, member or task. Toggl records a role only when the person tracks time as a member of a project whose estimate source is Roles. Time tracked on projects using Manual or Tasks, and entries saved before a project switched to Roles, show as Without role. Exports follow the same breakdown. Role breakdown is available on Starter and above. To set up roles, see Overview of the Members page.
Breaking down by time: the Breakdown by picker has a Time section with Date, Weekday, Week, Month, Quarter and Year, so you can see time per day, week or month without exporting. Time rows run oldest first, and weekdays start on your first day of the week, in your account timezone. Click the column header to reverse the order.
Breaking down by billable status: choose Billable status to split rows into Billable and Non-billable. It follows the same billable permissions as the rest of the report.
Hiding weekends: turn on Hide weekends in the report settings (the cog) to leave time logged on Saturdays and Sundays out of the totals, the charts and the table. The switch applies to the Summary report only.
Time and billable status breakdowns and Hide weekends are saved with the view, so saved views, shared reports and public links open the same way, and CSV, XLSX and PDF exports follow them.
Each row's share of the total
The breakdown table can show how much of the current report each row accounts for. These columns are on every plan. Logged time % is on in the default layout. If you have rearranged the columns, turn it on from the column picker on the table. Billable time %, Amount % and Cost % stay off until you turn them on there.
The columns are saved with the view, so they show on reports you share inside the workspace and on a public link. CSV and XLSX include a column when it is turned on. The PDF breakdown keeps its own Duration, % and Amount columns.
- Logged time % — this row's logged time divided by the logged time in the report. Anyone who can open the Summary report can see it.
- Billable time % — this row's billable time divided by the billable time in the report. It shows when you can see billable rates, the same access as the Amount column. This is separate from Billable %, which is how much of that row's own logged time is billable.
- Amount % — this row's amount divided by the amount in the report. It shows when you can see the Amount column.
- Cost % — this row's cost divided by the cost in the report. It shows when you can see the Cost column.
The percentages use the report you are looking at, including its date range and filters. A nested row, such as a task under a project, is still a share of the whole report. Amount % and Cost % follow the currency the report is showing, including a currency you convert the report into.
When you break the report down by tag, or by a multi-select or users custom field, one time entry can sit in more than one row. Those rows can add up to more than 100%. The chart notes the same thing: entries with several values count toward each one.
If the report total for a column is zero, that percentage is left blank.
For each project or task, you'll see:
- Whether it's marked as billable
- Billable % — how much of that row's logged time is billable, separate from Billable time %
- Billable vs. total time
- Total project billable amount
- Project total estimated time
- Region
Note: If billable data isn't showing, check that time entries in your workspace are marked as billable.